Many market participants have been surprised by the recent strength of the U.S. equity “market”. But which market? Are the U.S. capital markets homogeneous, propelled by the same fact pattern or are they fragmented, responding instead to their construction and the economic impulses that they are most sensitive to? In fact, they are both. A particular economic backdrop can lead some sectors, industries, and stocks to surge, while punishing others. Depending on where we sit within an economic cycle, growth and value stocks may diverge, as will domestically and internationally focused companies, and large and small companies. But there’s an added dimension. How market indexes are constructed will heavily influence returns. The Dow Jones Industrial Average is price weighted, meaning that the highest priced stocks have the greatest influence on the performance of that index. Doesn’t make much sense, but that’s what Charles Dow came up with 140 years ago. The tech-heavy Nasdaq index responds to growthy and sometimes nascent opportunities (think AI). The Russell 2000 index is, by definition, a snapshot of the smallest companies in the U.S. And finally, the S&P 500 index, the gold standard in determining American corporate strength, has its own quirks.
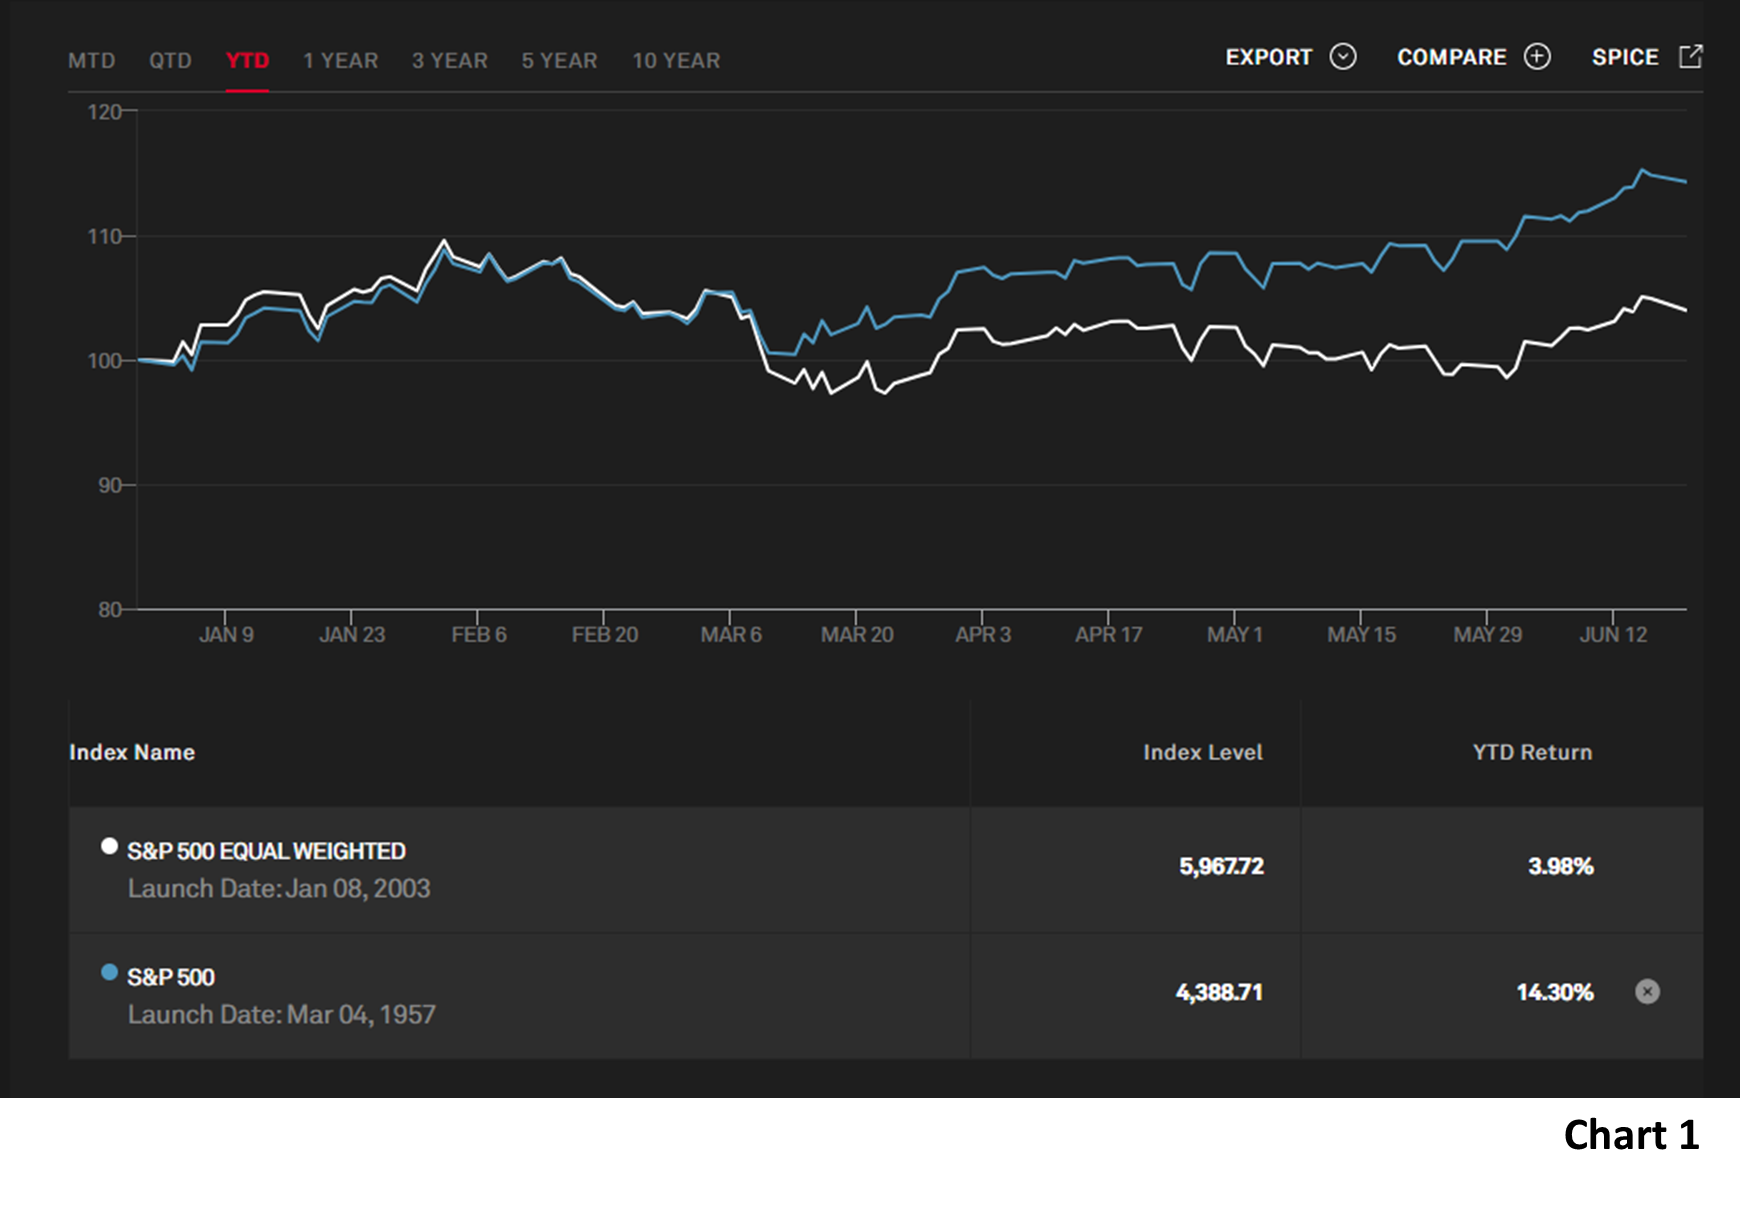
As illustrated in Chart 1, the S&P 500 index has advanced over 14% in 2023, but virtually all the gain has come from just 8 of the 500 companies. That’s because the index is “capitalization weighted”, meaning the larger the company, the more influence it exerts on the performance of the index. By contrast the “equal weighted” version of the S&P 500 Index is up just 4%, fully 10% worse than the cap weighted index. Drilling down, it’s not a coincidence that, as can be seen on Chart 1, the divergence began almost to the day that Silicon Valley Bank (SVB) failed. Money flow changed dramatically in March because the Regional Banking “crisis” signaled that the Fed had pushed rates so far, so fast as to cause an economic accident. They had to take their foot off the accelerator, and that’s exactly what happened. Why did money flow suddenly gravitate towards those 8 stocks? One reason is because they are all high growth stocks that are the most sensitive to interest rates. Future cash flows are worth more at lower interest rates levels. The corollary was seen in 2022 as this same group suffered mightily…as interest rates were being pushed higher. Another reason is the excitement around new technologies, specifically Artificial Intelligence.
Understanding market action is challenging at the best of times, but the moving parts this year have been enough to make heads spin. What we know and is widely reported is that inflation is coming down and central bankers are nearing the end of an unprecedented tightening cycle. What we don’t know is a longer list;
Will the lag effect of the historically large and rapid rise in interest rates show its teeth in the form of a “deep” recession? Will that lead the Fed to cut rates?
Is the dislocation caused by the pandemic going to lead to a long period of labour shortages and create ballast for the economy?
How will Artificial Intelligence (AI) affect productivity within the economy?
Is the market expensive or cheap?
At Goodreid we think the best place to start the analysis is to throw away the history books. There are just too many factors and influences that are unique to our time. The pandemic changed societies in fundamental ways, many of them behavioral in nature. Large swaths of the working public no longer go to an office five days a week. A substantial piece of the workforce (baby boomers mainly), simply retired, or transitioned into the GIG economy. There was a massive transfer of wealth from governments in the form of economic stimulus, by some reports up to 5 trillion dollars in the U.S. alone. Much of that money remains dry tinder for investment. And finally, we are witnessing the accelerating effects of technology.
Technology has become integral in our economy, leading a revolution that may make the “Industrial Revolution’ pale in comparison. Artificial intelligence has the potential to add trillions of dollars of value to economies through growth of GDP. Corporate profit margins are ripe for improvement. AI will also be a strong deflationary tool. The best antidote to core inflation is productivity, producing more output for the same cost. The potential is staggering.
While trying to define today’s circumstances through precedent is difficult, we are aware that historical divergences between cap weighted and equal weighted index returns have always resolved themselves, in fact as recently as February of this year the 10-year performance record of each group was virtually identical. This happens not because of coincidence but because of the age-old laws of economics. As the price of something goes up, its value tends to drop, and vice versa, leading to heightened pressure to correct the imbalance. Chart 2 illustrates this point. On the far right one can clearly see the effect on valuations on these groups. While the “Mega Cap 8” has a P/E pushing 30 times and their influence on the S&P 500 index valuation has pushed it to 18X, the unweighted index has seen valuations fall recently to an historically attractive 15.6 times.
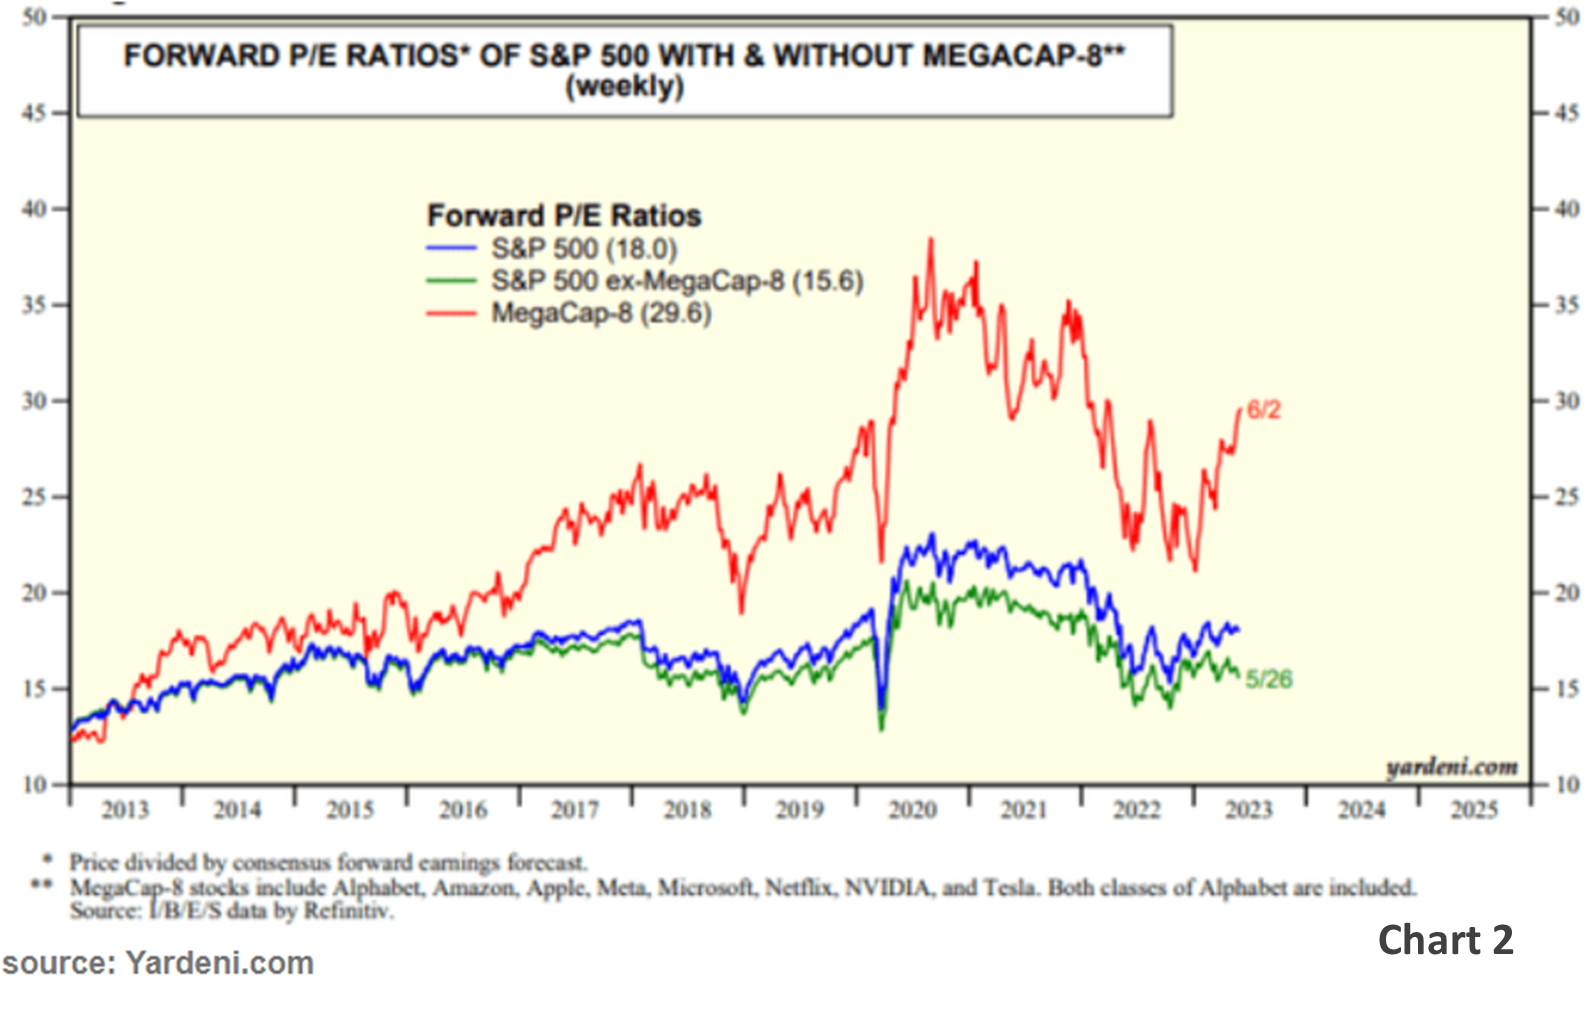
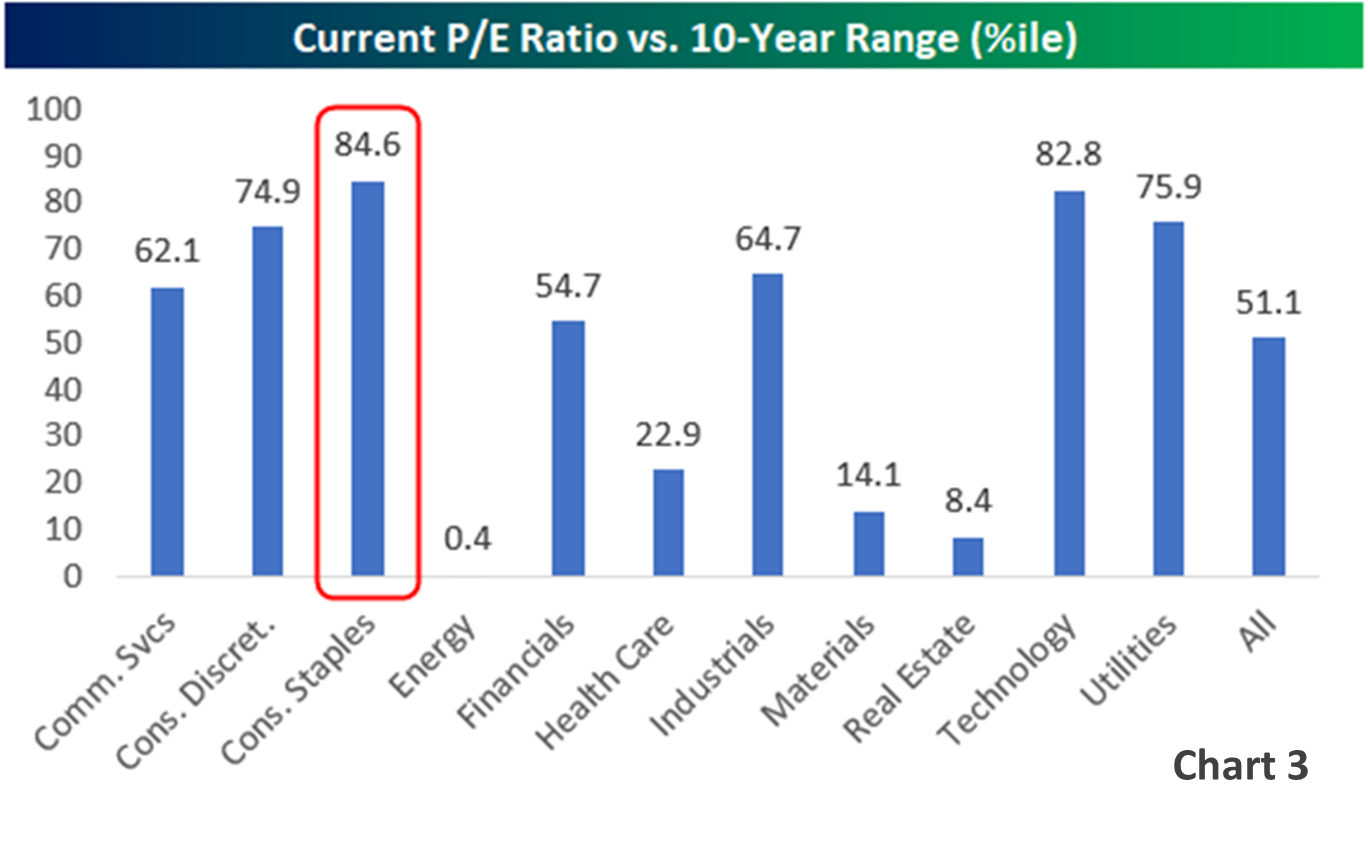
Chart 3 continues our deep dive. Within the market, which sectors are in favour and which are being neglected? This table shows major market sectors and illustrates whether they are expensive or inexpensive when compared to their 10-year history. The highlighted Consumer Staples sector ranks at almost the 85th percentile of its 10-year P/E history. In other words, pretty expensive, only being cheaper 15% of the time. Conversely, the Energy sector is dirt-cheap, having P/Es lower only 0.4% of the time in the past 10 years. Using this type of information, we can focus our research on inexpensive sectors such as Energy, Healthcare, Materials and Real Estate, in an effort to couple these historically inexpensive readings with quality fundamentals, including profitability and momentum.
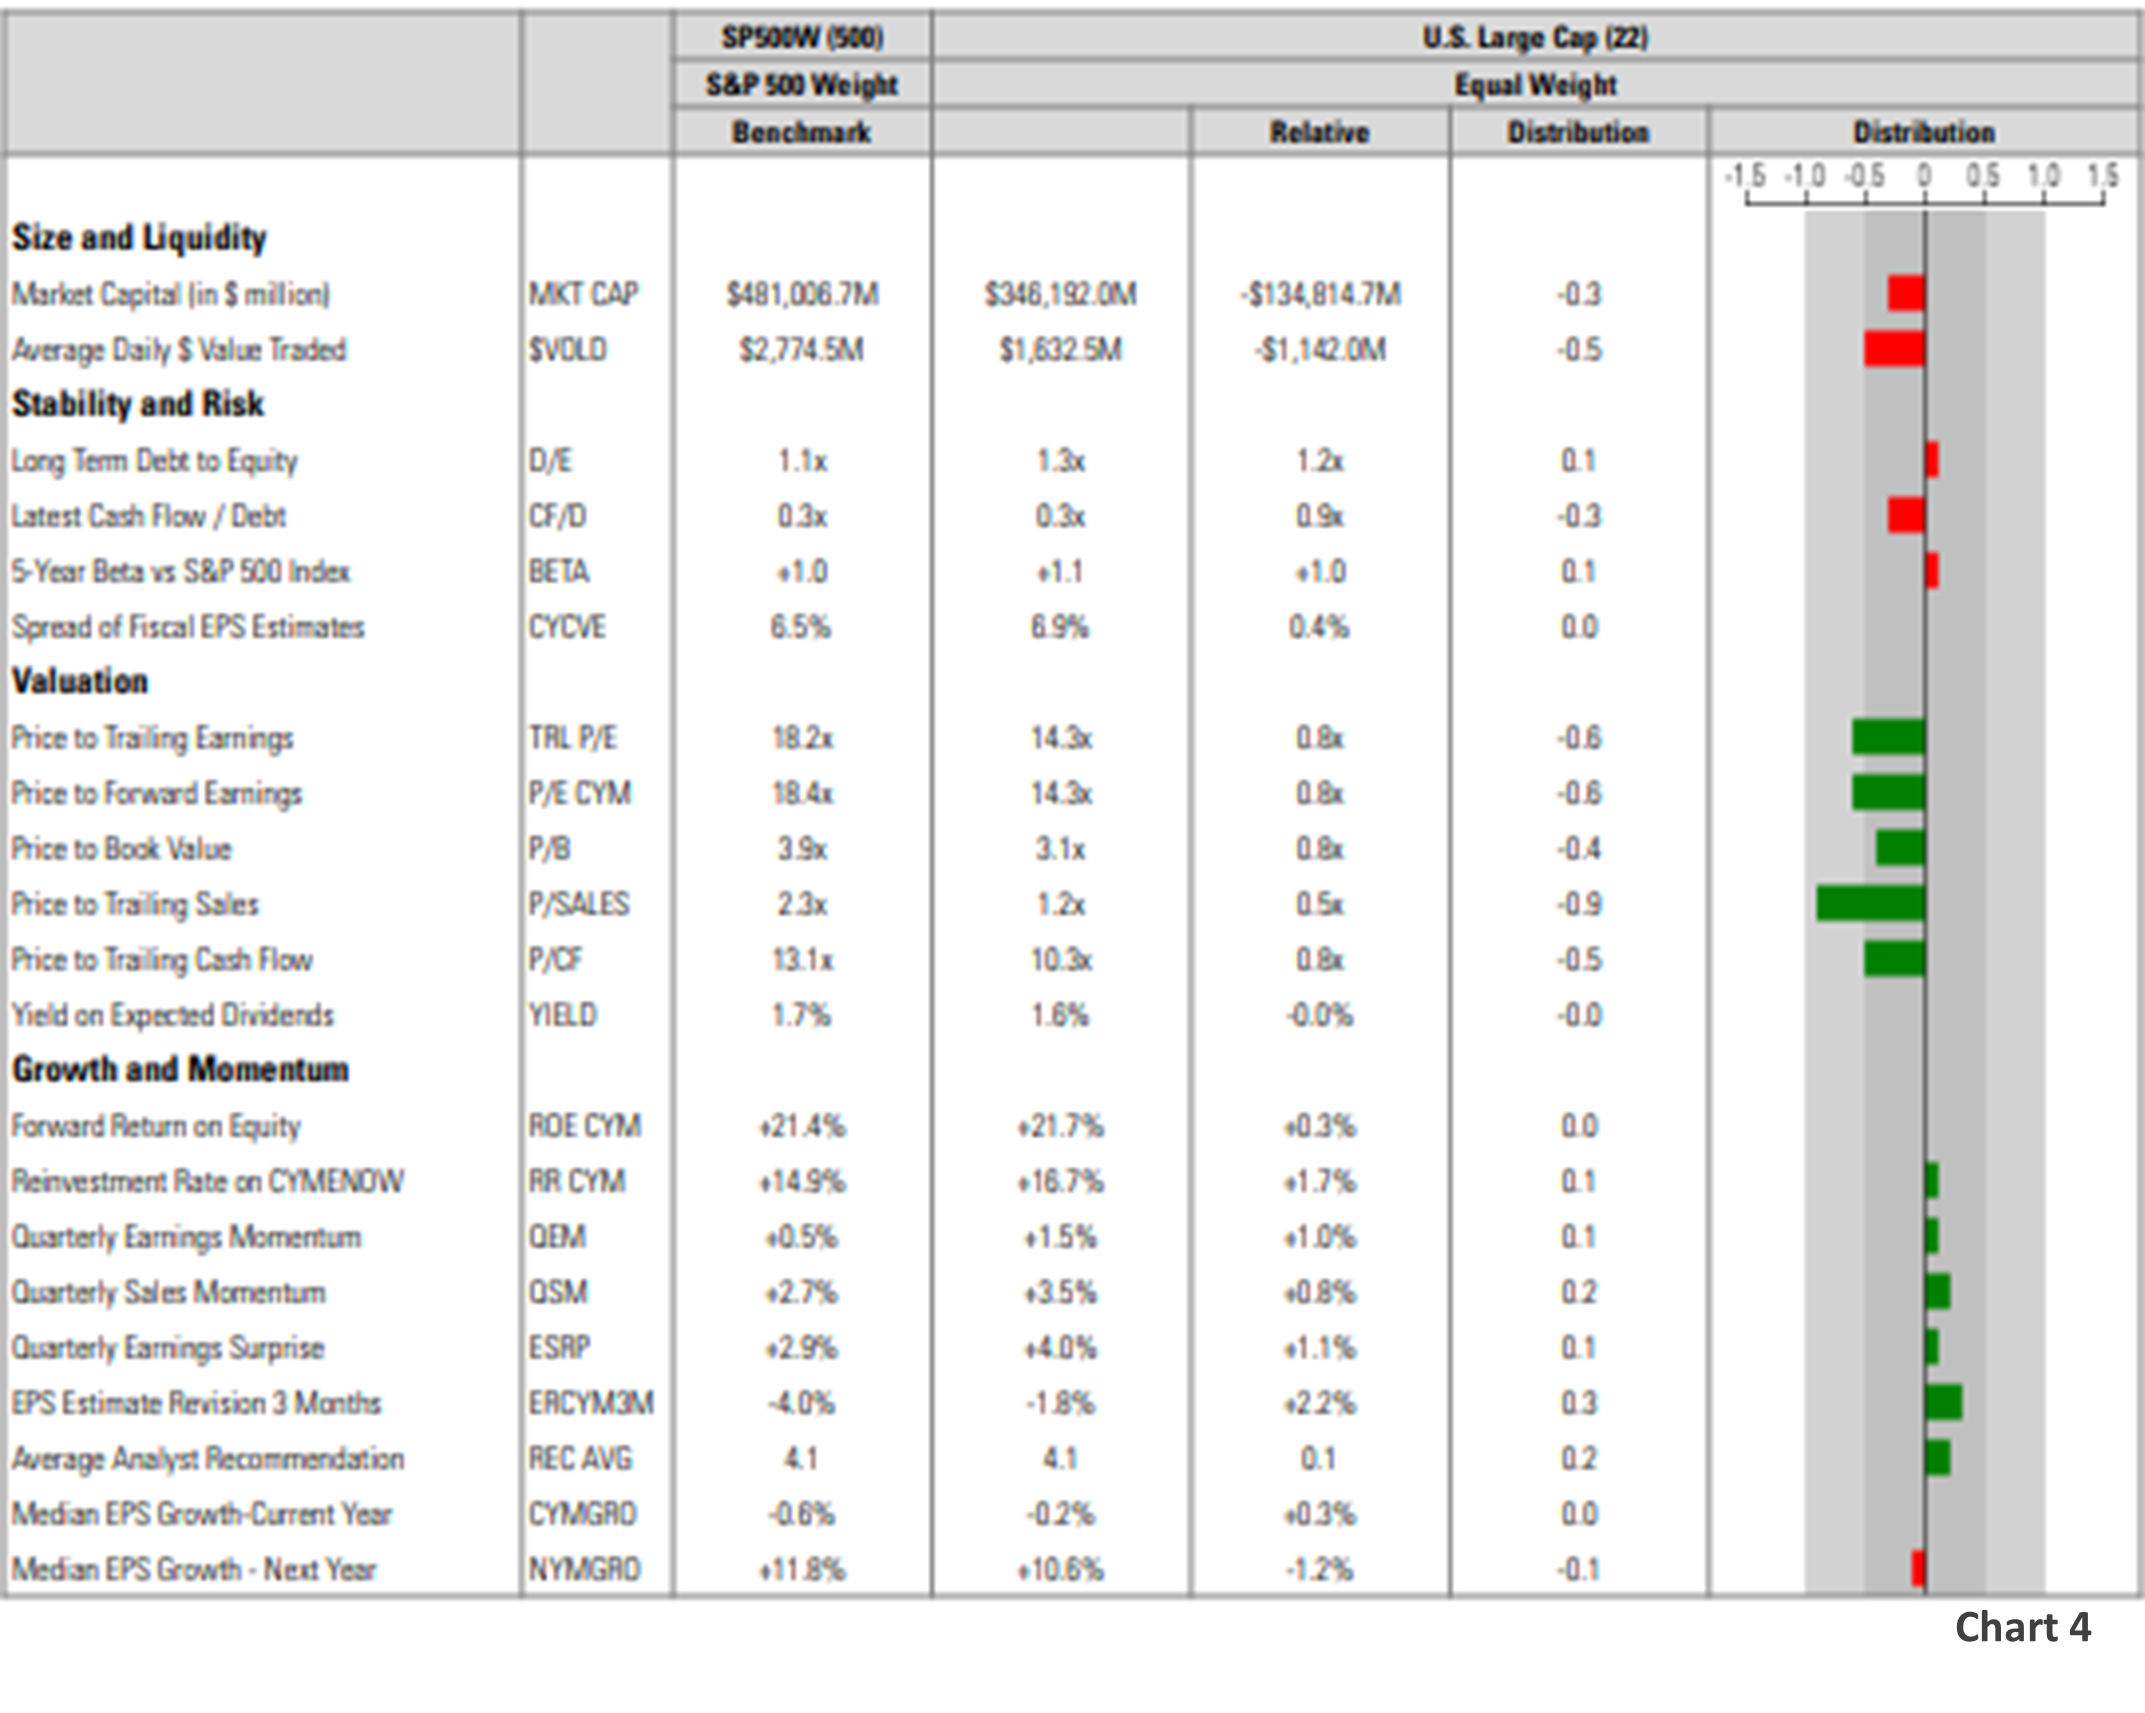
Finally, Chart 4 is a factor attribution table illustrating how Goodreid’s Large Capitalization portfolio compares to the S&P 500 Index. Think of your portfolio as a giant conglomerate. When consolidated it has defined attributes that can be analytically useful. We are encouraged to see that the majority of our growth and momentum characteristics are superior to the market, and at the same time, our valuation profile is demonstrably better. Utilizing other pieces of research, including Chart 2, we can deduce that on an unweighted index basis, our comparative Growth and Momentum readings would improve and that our valuation reading would dampen slightly, but remain superior.
No investor wants to base their investment decision on FOMO (Fear of Missing Out). A clear-eyed analysis points to these observations. It is an exciting time to be an investor. Innovation is rampant and there’s a strong feeling of opportunity. But seasoned investors know that a conservative and disciplined approach will both achieve goals and let them sleep at night. The mega cap names that have propelled the markets have great promise as companies but are expensive as stocks. A degree of participation is warranted to ensure participation in the AI revolution but diversification into more unloved sectors and stocks that offer great promise provides the necessary hedge for our style of investing.